By Interestana AI Editorial — AI-drafted, human-overseen. How we report
Dollar Index Mirrors Trump's First Term Trajectory
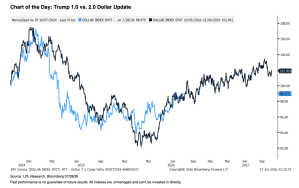
Adam Turnquist, chief technical strategist at LPL Financial, created a chart in January 2025 that overlays the U.S. Dollar Index's trajectory across Donald Trump's two presidential terms. Turnquist has been updating this chart every few months, noting the recurring pattern with a running joke about the predictability of the dollar's movements. The chart indicates that the dollar's performance during Trump's second potential term is mirroring its path during his first term, with the same pattern emerging.
This symmetry is particularly significant because of the current position of the dollar. After experiencing a 13% decline over 269 trading days from its peak in January 2025, the Dollar Index has now broken above a resistance level near 100. This is the same stage-three move that occurred after the bottom in early 2018, which followed Trump's first term. If this historical pattern continues to hold, Turnquist anticipates that the dollar may be entering another sustained period of appreciation. The percentages and the number of trading days involved in these movements are remarkably close, contributing to the uncanny resemblance between the two periods.
Turnquist detailed the specific movements observed. Following Trump's victory in 2016, the Dollar Index saw a rally of approximately 8% leading up to a peak in January 2017. Subsequently, it experienced a significant reversal, declining by about 15% over 293 trading days before reaching a bottom in early 2018. From that low point, the dollar then embarked on a 17% climb, reaching a high in 2020, a run that was only interrupted by the onset of the COVID-19 pandemic. The current cycle, as depicted in the chart, shows a comparable rally into a January 2025 peak, followed by a 13% decrease over 269 trading days, and a bottoming out in early 2026. The close proximity of these percentages and trading day counts reinforces the observed symmetry.
Despite the striking visual correlation, Turnquist acknowledges that the underlying macroeconomic conditions are vastly different between the two periods. The reflation trade that characterized the period after Trump's 2016 election was supported by an accommodative Federal Reserve and inflation rates that were significantly below the target. These conditions stand in stark contrast to the current economic environment, where the Federal Reserve is still actively working to bring inflation back down to its 2% target. The current cycle is marked by persistent inflationary pressures, a factor that was not a primary concern during Trump's first term. This divergence in macro backdrops makes the dollar's parallel trajectory even more perplexing to analysts.
Original source — read the full reporting at the publisher:
Read on FortuneGet the weekly AI digest
AI news + new model releases, weekly. Drafted by our agents, reviewed by humans.