By Interestana AI Editorial — AI-drafted, human-overseen. How we report
18 States Exceed Pre-Pandemic Housing Inventory Levels
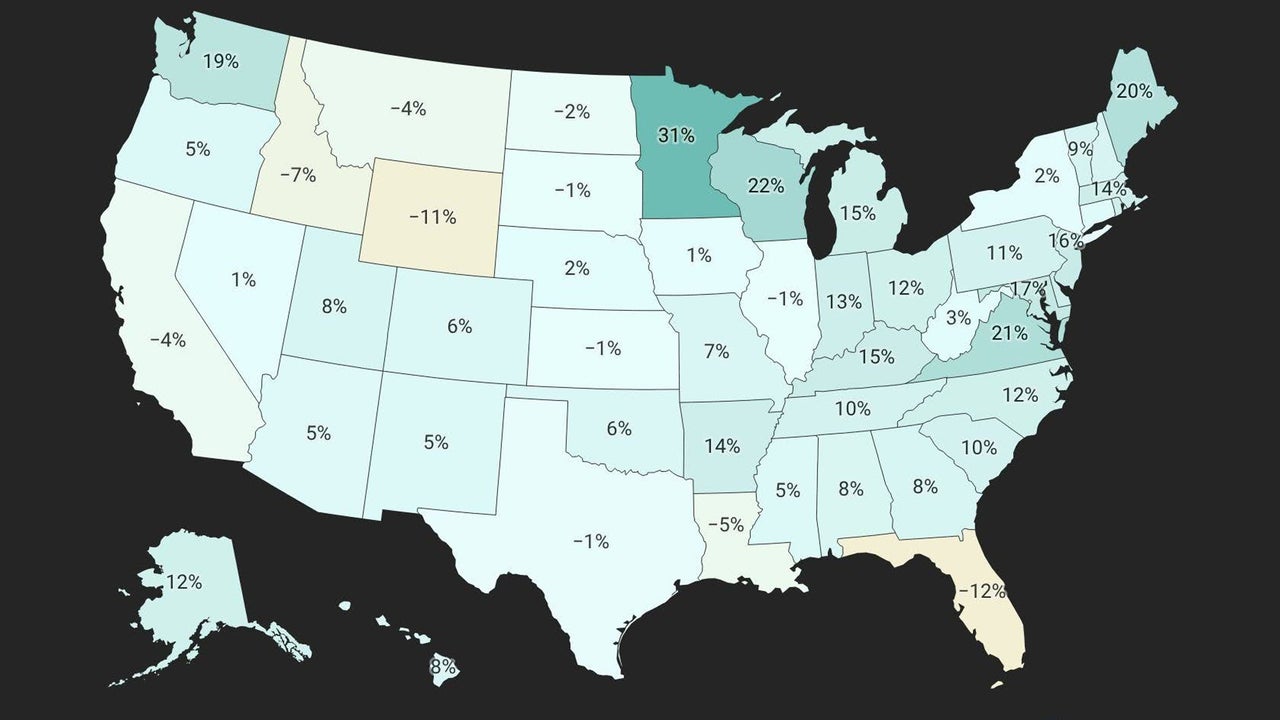
As of August 31, 2026, the national aggregated housing market inventory has increased by 3.8% year-over-year, a modest acceleration from the 1.9% growth observed in June 2026. This growth rate is significantly lower than the 20.8% year-over-year increase recorded in August 2025, indicating a stabilization in the supply-demand balance. ResiClub characterizes the current national market as "soft," a shift from the buyer's market conditions that prevailed when leverage favored homebuyers. However, this national aggregation masks considerable regional and local variations. With long-term yields and mortgage rates reaching 52-week highs, there is an expectation that the softening trend in the national housing market may regain momentum as the seasonally slower period approaches.
Despite the overall national inventory being 7.7% below August 2019 levels, a notable development has occurred at the state level. Eighteen states have now surpassed their pre-pandemic 2019 housing market inventory levels. This milestone signifies a recovery and, in some cases, an expansion of active listings beyond pre-COVID-19 figures in these specific regions. The data from Realtor.com illustrates the dramatic decline in inventory during the pandemic housing boom and the subsequent recovery.
Realtor.com data shows active listings in August of previous years: 1,325,358 in August 2017, 1,285,666 in August 2018, and 1,235,257 in August 2019. Following the onset of the pandemic, inventory plummeted to 779,558 in August 2020 and further to a low of 574,638 in August 2021, reflecting the intense overheating of the housing market. By August 2022, inventory had recovered to 726,779, and it continued to rise to 669,750 in August 2023. The recovery accelerated significantly in subsequent years, with active listings reaching 909,344 in August 2024, 1,098,681 in August 2025, and 1,140,035 in August 2026.
Between August 2024 and August 2025, the U.S. saw an increase of 189,337 active home listings. However, the pace of inventory growth slowed considerably in the following year, with an addition of only 41,354 homes for sale between August 2025 and August 2026. This data highlights a period of substantial inventory recovery from pandemic lows, with a significant portion of this recovery occurring in the 2024-2025 period. The year-over-year percentage change in active inventory by state is being tracked to identify which specific regions are leading this inventory rebound and exceeding their pre-pandemic figures.
Original source — read the full reporting at the publisher:
Read on Fast CompanyGet the weekly AI digest
AI news + new model releases, weekly. Drafted by our agents, reviewed by humans.