By Interestana AI Editorial — AI-drafted, human-overseen. How we report
US Housing Inventory Growth Accelerates Year-Over-Year
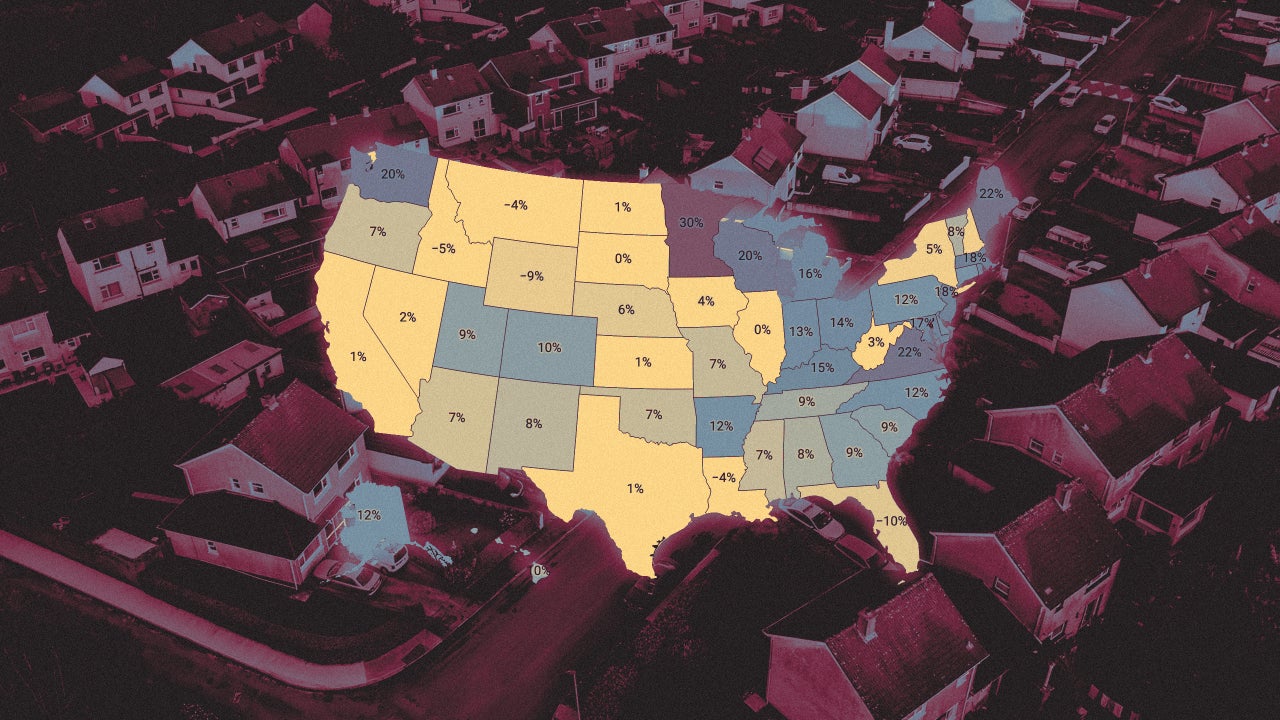
Nationally aggregated housing inventory experienced a 5.6% year-over-year increase between September 30, 2025, and September 30, 2026. This marks the third consecutive month where the year-over-year growth in active listings for sale has accelerated, though the pace of acceleration is modest compared to previous periods. For context, the year-over-year inventory growth rate in June 2026 was 1.9%, and a year prior, between September 2024 and September 2025, national inventory growth was significantly higher at 16.9%. Despite the recent acceleration, the current growth rate suggests a softening national housing market, providing buyers with increased leverage in many areas over the past year. The continued upward trend in inventory levels is occurring as long-term yields and mortgage rates have returned to two-year highs, a factor that will be monitored for its impact on market momentum as the market enters its seasonally slower period.
Active housing inventory in the United States is approaching pre-pandemic levels recorded in 2019. As of September 2026, the national inventory was 5.2% below the September 2019 figure. Realtor.com data illustrates the fluctuations in active listings: September 2017 saw 1,308,607 active listings, followed by 1,301,922 in September 2018, and 1,224,868 in September 2019. The onset of the pandemic housing boom led to a sharp decline, with inventory falling to 749,395 in September 2020 and reaching a low of 578,070 in September 2021. Following this, inventory began to recover, reaching 731,496 in September 2022 and 702,430 in September 2023. The most recent data shows a significant increase, with 940,980 active listings in September 2024, climbing to 1,100,407 in September 2025, and further to 1,161,615 in September 2026.
The period between September 2024 and September 2025 saw a substantial addition of 159,427 homes to the U.S. active inventory. However, the subsequent 12-month period, from September 2025 to September 2026, experienced a more moderate increase of 61,208 homes. This deceleration in the rate of inventory growth, despite an overall increase, suggests a complex market dynamic. The data also highlights significant variations at the state level, with year-over-year active inventory percentage changes differing across the country. These state-specific figures are crucial for understanding the localized impacts of broader national trends in housing supply and demand. The interplay of rising interest rates and increasing inventory is expected to shape buyer and seller behavior in the coming months, particularly as the market moves into the typically slower fall and winter seasons.
Original source — read the full reporting at the publisher:
Read on Fast CompanyGet the weekly AI digest
AI news + new model releases, weekly. Drafted by our agents, reviewed by humans.