By Interestana AI Editorial — AI-drafted, human-overseen. How we report
Bitcoin Traders Eye 'Bart Simpson' Pattern Amidst Market Volatility
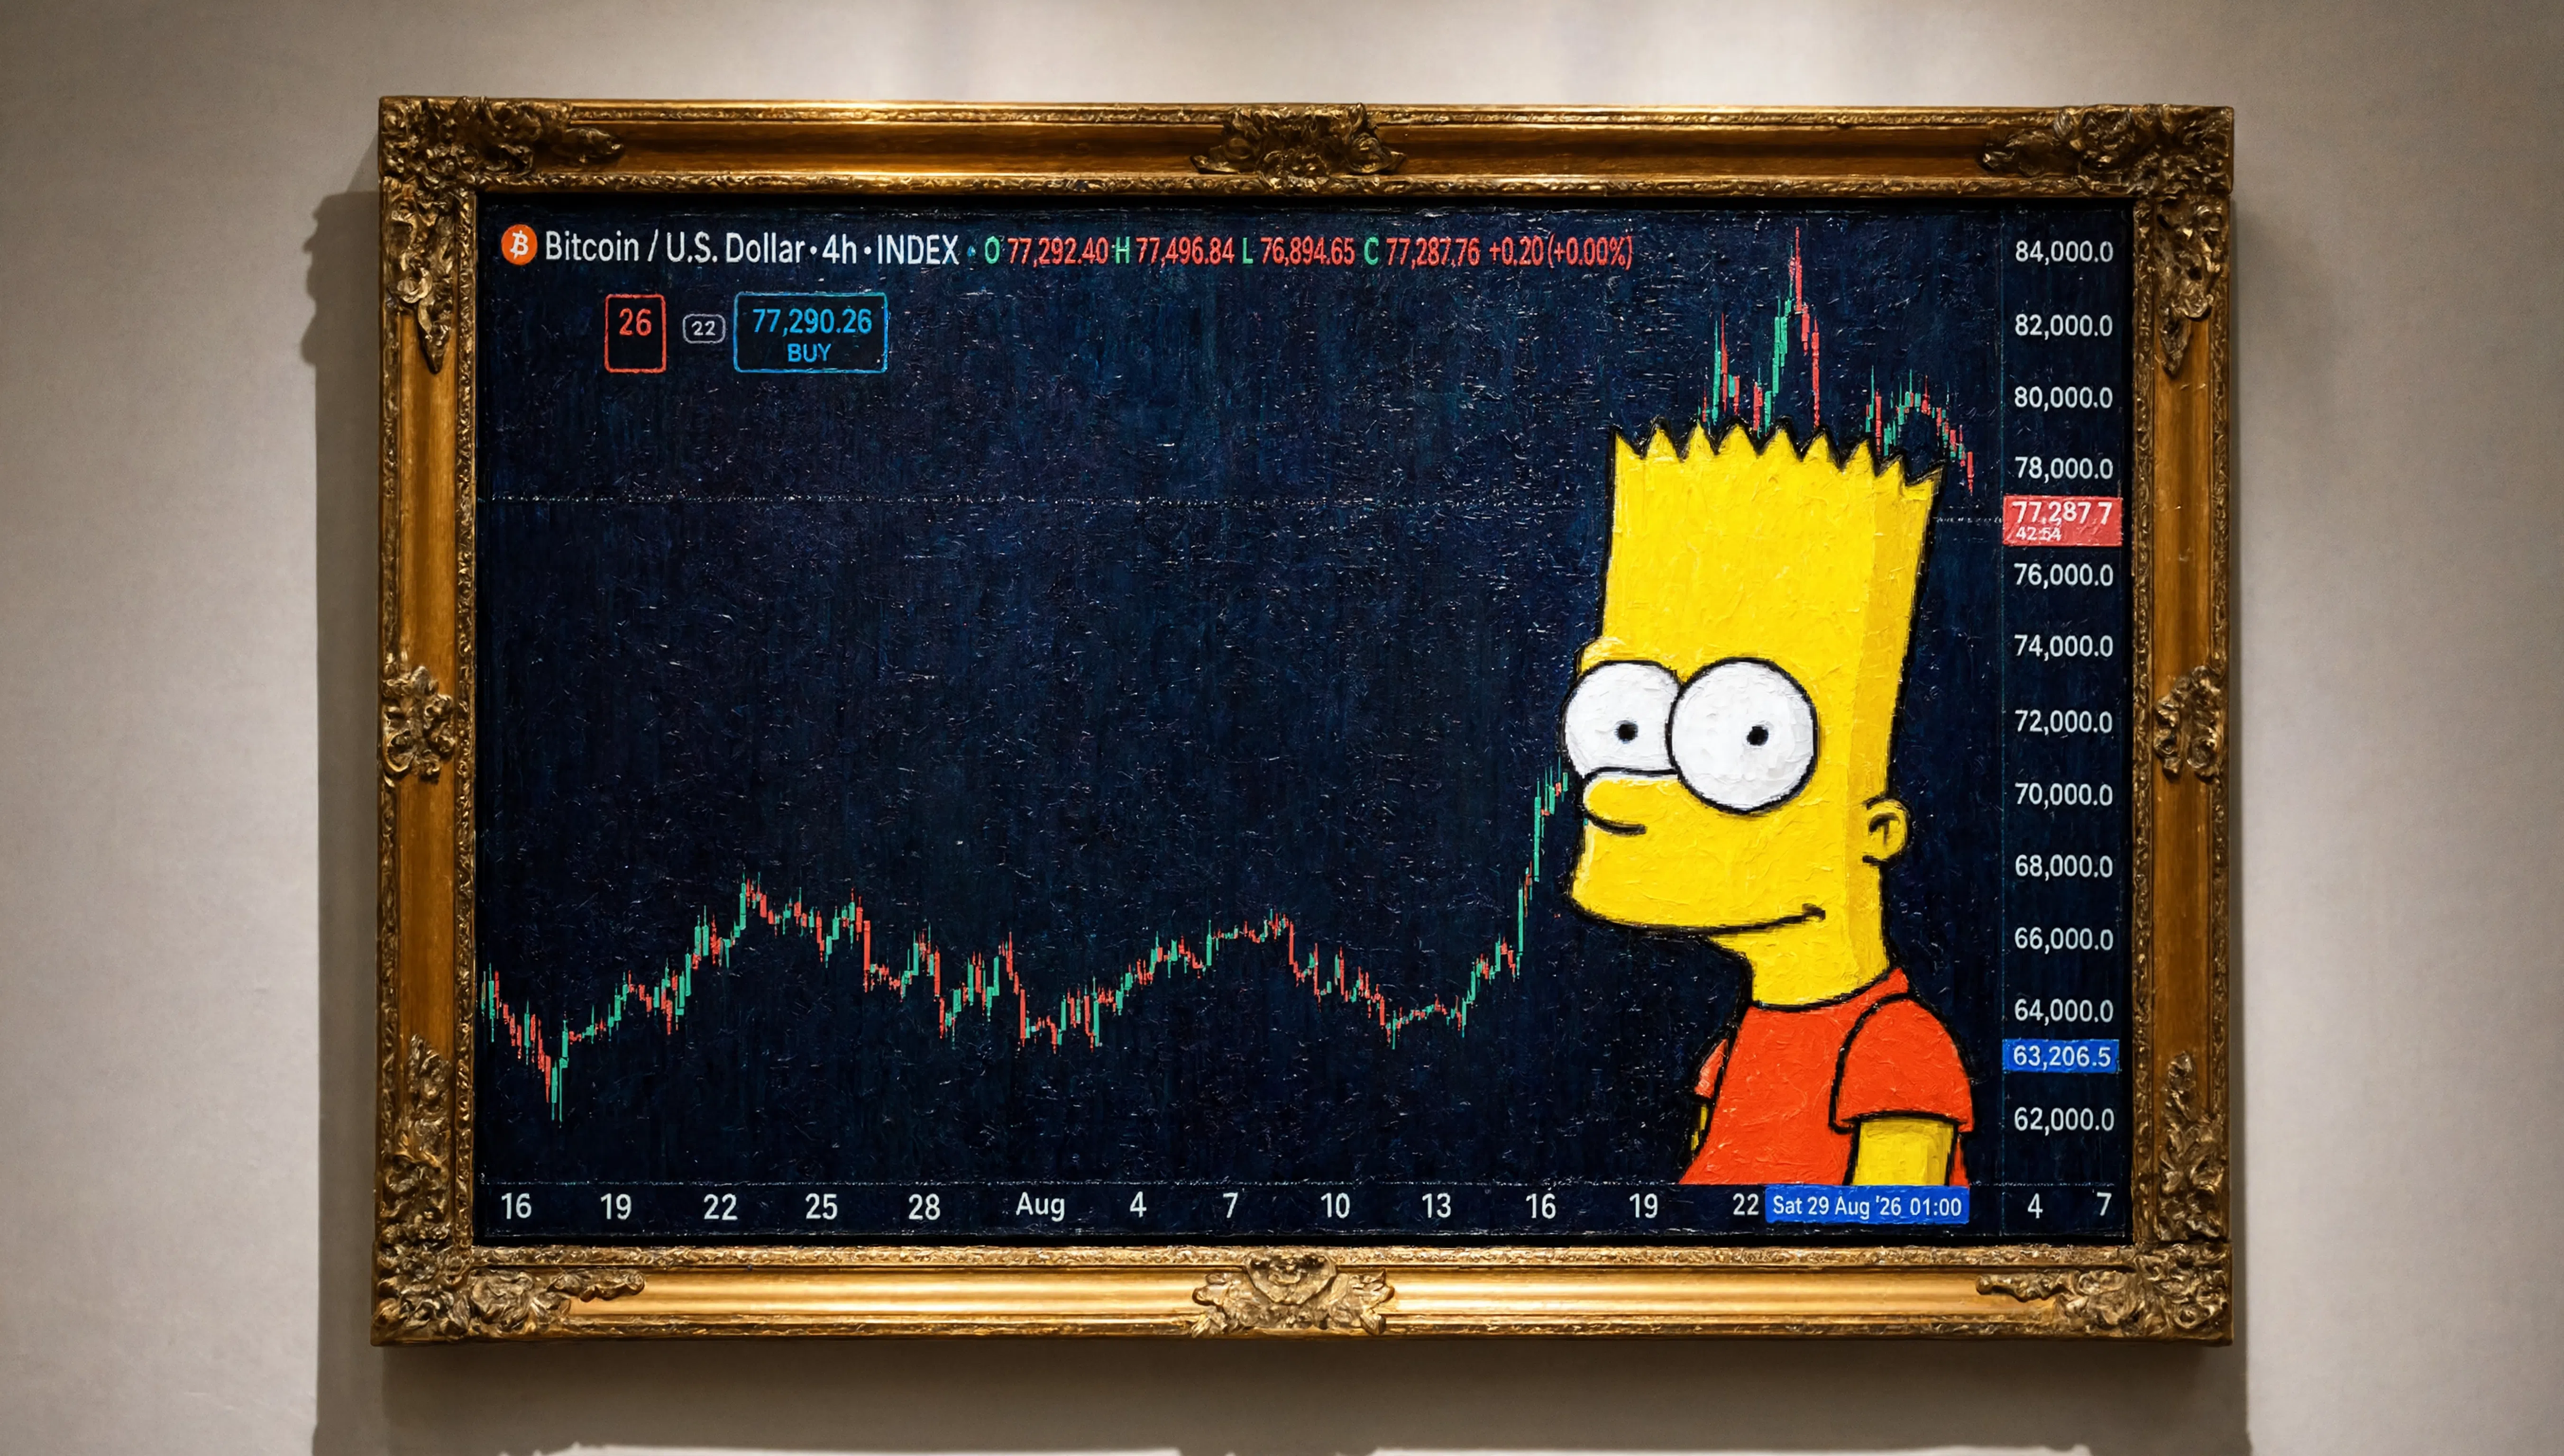
Bitcoin traders are observing a price movement pattern in August that some are colloquially referring to as a 'Bart Simpson' hairline. This pattern is characterized by a sharp, rapid increase in price, followed by an equally swift and significant decline, resembling the distinctive hairstyle of the animated character Bart Simpson. This observation comes amidst ongoing volatility in the cryptocurrency market, prompting discussions about the potential for a flash crash versus a more typical market correction.
A flash crash in the context of Bitcoin is defined by an extremely rapid and severe price drop that occurs within a very short timeframe, often minutes or hours, with little to no apparent fundamental reason. These events are typically driven by a cascade of automated sell orders, often triggered by algorithmic trading strategies or significant liquidity evaporation. In contrast, a market correction is a more gradual and expected decline in asset prices, usually following a period of substantial gains, and is often attributed to profit-taking, shifts in market sentiment, or broader economic factors. The distinction is crucial for traders and investors seeking to understand the underlying dynamics of Bitcoin's price action and to manage their risk exposure effectively.
While the August price action exhibited a rapid ascent and subsequent fall, the duration and the underlying causes are being debated. Some analysts suggest that the pattern observed does not meet the criteria for a true flash crash. Instead, it might represent a significant correction or a period of heightened volatility driven by speculative trading and market sentiment. The cryptocurrency market, by its nature, is susceptible to rapid price swings due to its relatively smaller market capitalization compared to traditional financial markets and its sensitivity to news, regulatory developments, and investor sentiment. The presence of high-frequency trading algorithms and the interconnectedness of various trading platforms can also amplify price movements, making it challenging to differentiate between a sharp correction and a more systemic event like a flash crash.
Understanding the nuances between a 'Bart Simpson' pattern, a correction, and a flash crash is vital for navigating the cryptocurrency landscape. A true flash crash can lead to substantial and immediate losses for investors, often with limited opportunity to react. Corrections, while painful, are a more predictable part of market cycles and can present buying opportunities for long-term investors. The current market sentiment and the technical indicators are being closely watched by traders to determine the future trajectory of Bitcoin's price. The ongoing analysis of these patterns aims to provide clarity on whether the recent volatility is a temporary anomaly or an indicator of more significant market shifts to come, influencing trading strategies and investment decisions across the digital asset space.
Original source — read the full reporting at the publisher:
Read on DecryptGet the weekly AI digest
AI news + new model releases, weekly. Drafted by our agents, reviewed by humans.