By Interestana AI Editorial — AI-drafted, human-overseen. How we report
US Home Prices Up 1.3% Year-Over-Year
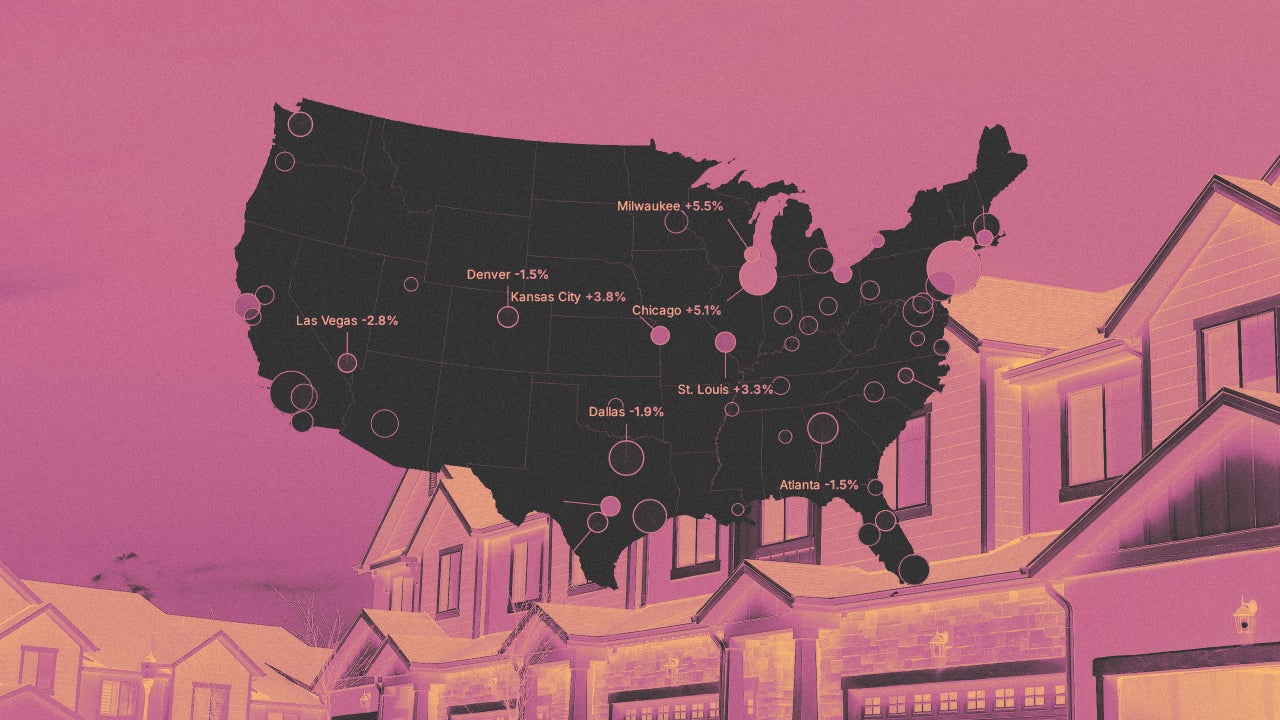
U.S. home prices experienced a year-over-year increase of 1.3% between August 2025 and August 2026, according to an analysis of the Zillow Home Value Index. This marks an acceleration from the previous year, when the national year-over-year home price shift rate was -0.01% in August 2025. The national housing market has stabilized into a period of low appreciation, with the pace of softening losing momentum over the past 12 months. However, recent increases in long-term yields and mortgage rates may influence this trend in the coming months. Regional variations persist, with some markets in Texas, Florida, and Colorado, where inventory has surpassed pre-pandemic 2019 levels, still undergoing mild home price corrections. Conversely, markets with tighter inventory in the Northeast and Midwest have shown resilience, with home prices likely experiencing slight increases this year. San Francisco, in particular, is observing notable upward pricing activity attributed to the AI wealth boom. The analysis considers month-over-month (MoM) shifts from July 2026 to August 2026 and year-over-year (YoY) shifts from August 2025 to August 2026 across America's 50 largest metro housing markets. The period between July and August typically falls within the seasonally softer window for the national housing market. Prior analysis in spring 2022, while at Fortune, identified pandemic boomtowns like Austin as being at higher risk for home price corrections. The Zillow Home Value Index is a widely recognized measure of home price appreciation and depreciation, calculated by aggregating sale prices of homes across the United States. The data provides a snapshot of the real estate market's performance on a national, regional, and local level, offering insights into economic conditions and consumer confidence. The current market conditions suggest a complex interplay of factors influencing home prices, including inventory levels, interest rates, and localized economic drivers such as the burgeoning AI industry in specific metropolitan areas. The year-over-year data for August 2026 will be compared against previous years to provide a historical perspective on the current market trajectory. This comparative analysis is crucial for understanding long-term trends and identifying potential shifts in market dynamics. The mention of specific states like Texas, Florida, and Colorado, along with regions like the Northeast and Midwest, highlights the diverse performance of housing markets across the country. The reference to San Francisco's AI wealth boom points to the impact of specific industry growth on local real estate values. The methodology employed by ResiClub, analyzing the Zillow Home Value Index, ensures a data-driven approach to understanding these market shifts. The inclusion of MoM and YoY metrics allows for both short-term and long-term performance assessments. The historical context provided by the spring 2022 analysis of pandemic boomtowns adds depth to the understanding of market cycles and risk factors.
Original source — read the full reporting at the publisher:
Read on Fast CompanyGet the weekly AI digest
AI news + new model releases, weekly. Drafted by our agents, reviewed by humans.