By Interestana AI Editorial — AI-drafted, human-overseen. How we report
Missoula, Montana Releases First Regional Heat Map
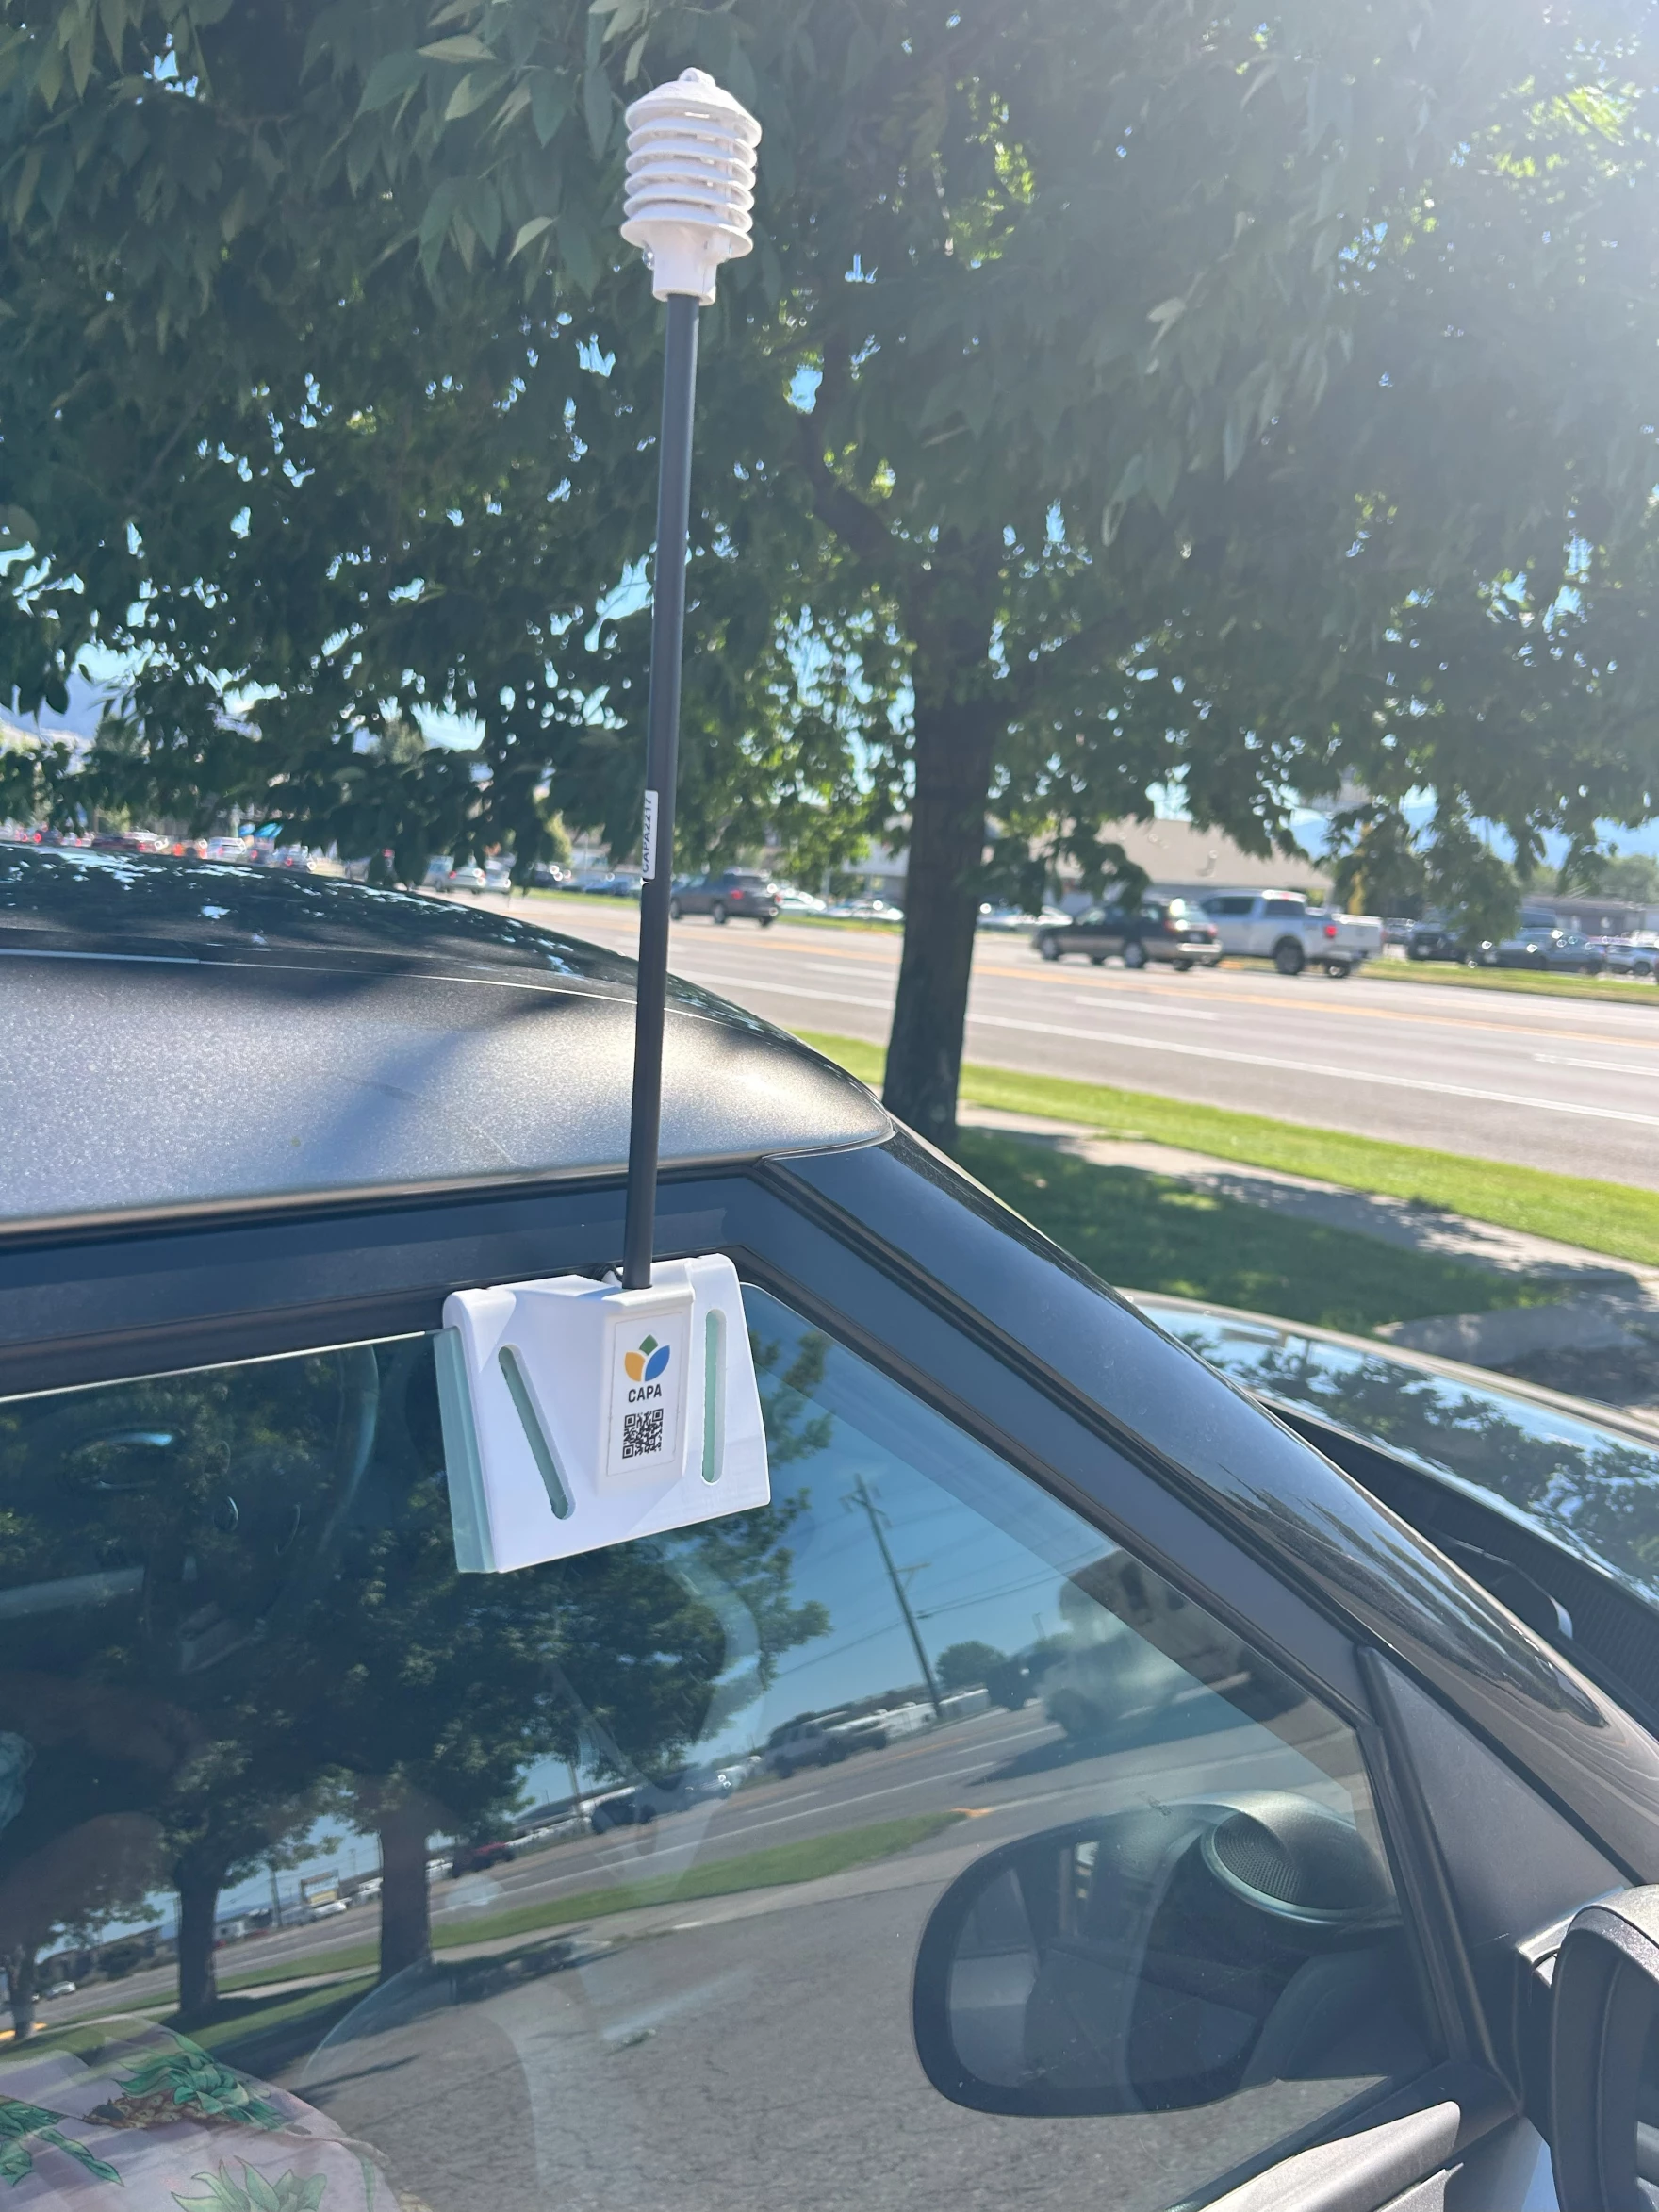
Missoula, Montana, has released its first-ever heat map for the region, a significant development in understanding localized temperature variations influenced by urban and rural landscapes. This initiative, spearheaded by the local nonprofit Climate Smart Missoula in partnership with the city and county, utilized federal funding to conduct a comprehensive heat mapping study across the county. The project involved volunteers driving transects throughout the county last summer, equipped with sensors that recorded temperature and humidity data every second. These granular measurements were then analyzed by the climate adaptation consulting firm CAPA Strategies, culminating in the creation of a publicly accessible heat map. This map is notable as the first of its kind for Montana and the broader Rocky Mountain region, filling a critical data gap as other states in the vicinity, such as Wyoming, North Dakota, and South Dakota, also lack similar regional heat maps.
The research underscores the well-documented phenomenon of the "heat island effect," where the presence of green spaces and shade significantly moderates ambient temperatures. Neighborhoods with more trees and permeable surfaces, as opposed to impermeable materials like pavement, can be 1 to 7 degrees Fahrenheit cooler. While this effect has been extensively studied in major urban centers, its application and impact in more rural areas like Missoula have received less attention. The findings are particularly pertinent for Missoula, which has historically experienced warm, dry summers with temperatures typically reaching the 80s and occasionally the 90s, followed by sharp nighttime cooling. However, recent years have seen a shift towards hotter summers and warmer nights, with an increasing number of days exceeding 90 degrees Fahrenheit annually.
Projections indicate a substantial temperature increase for Missoula County, with an average annual temperature expected to rise by 4 to 5 degrees Fahrenheit by 2050. This warming trend presents considerable challenges for a region whose infrastructure, including homes and public buildings, was designed for a cooler climate. Compounding this vulnerability is Montana's status as having one of the lowest rates of residential air conditioning in the United States, meaning a significant portion of the population may have limited recourse to mitigate extreme heat indoors. The heat map serves as a crucial tool for local authorities and residents to identify areas most susceptible to extreme heat and to develop targeted adaptation strategies, such as increasing tree canopy, promoting cool pavement technologies, and implementing public cooling centers. The data can inform urban planning decisions, public health initiatives, and community resilience efforts in the face of a changing climate.
Original source — read the full reporting at the publisher:
Read on GristGet the weekly AI digest
AI news + new model releases, weekly. Drafted by our agents, reviewed by humans.