By Interestana AI Editorial — AI-drafted, human-overseen. How we report
Bitcoin Price Action Hints at Potential $76,000 Surge
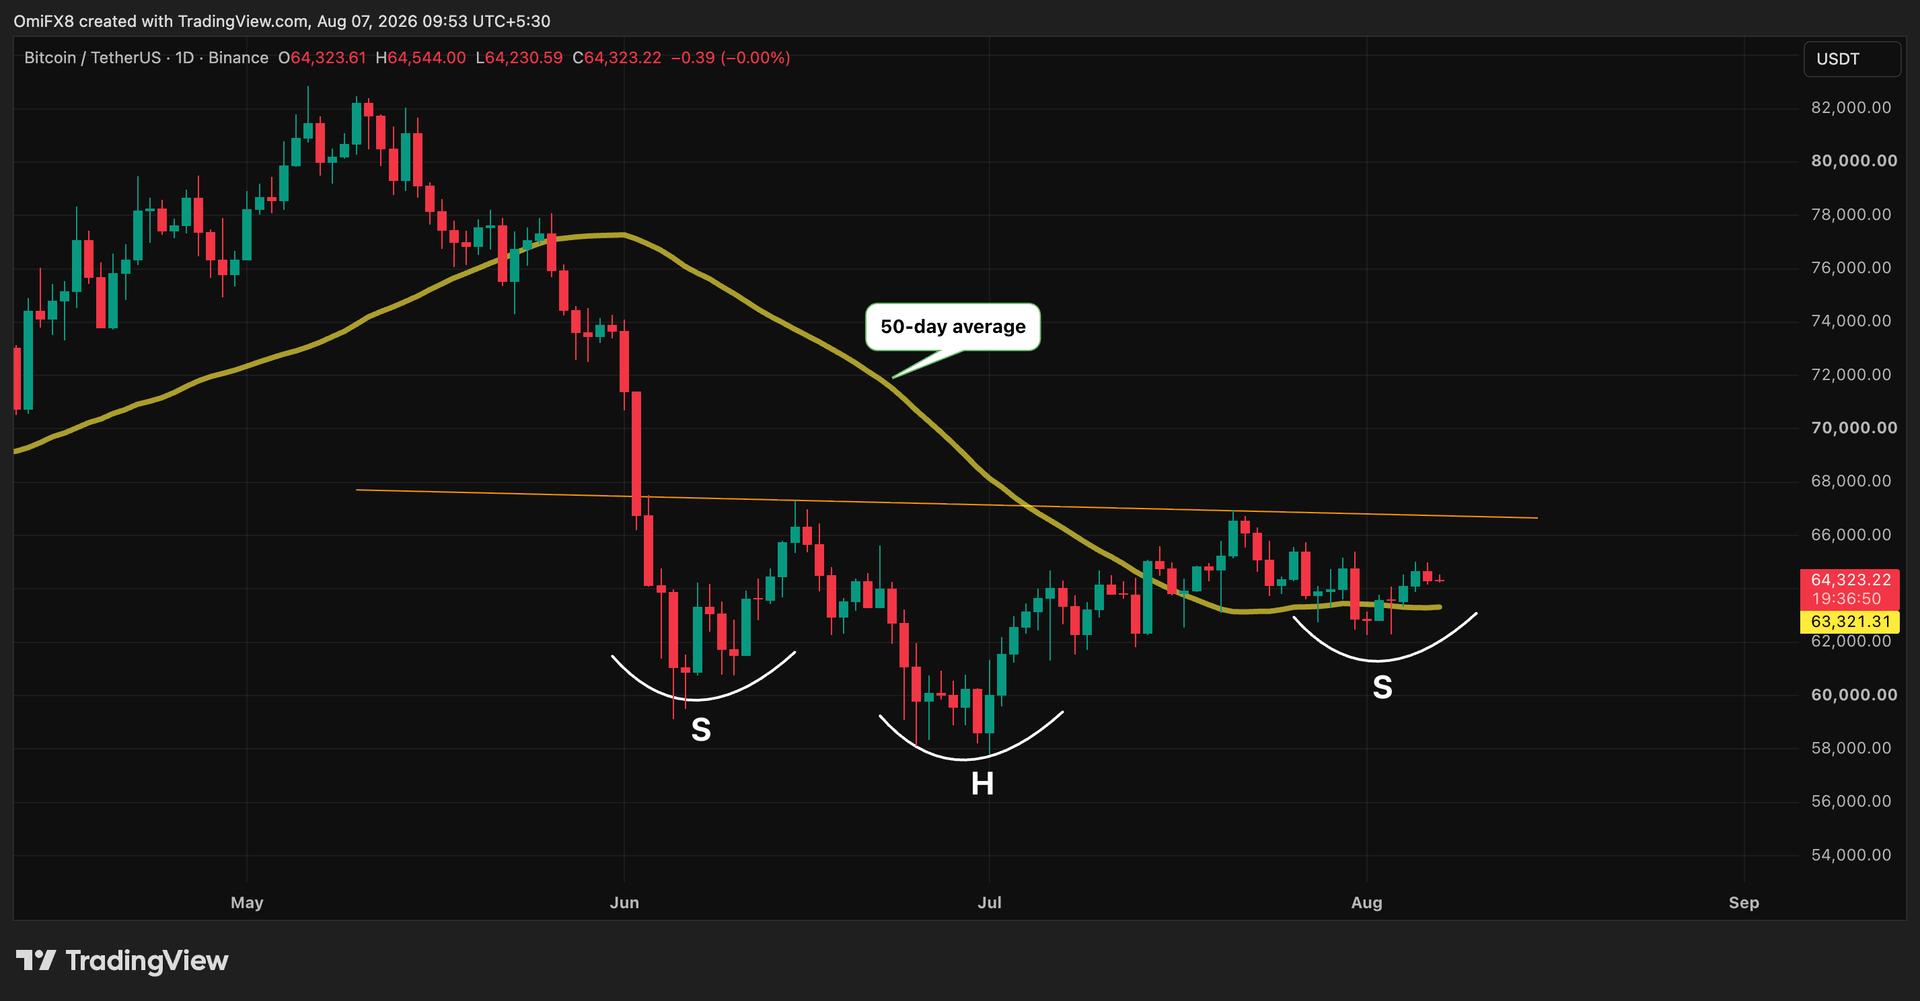
Bitcoin's price action is currently exhibiting a bullish technical setup that analysts are closely monitoring, suggesting a potential surge towards $76,000. This pattern, often referred to as a "bull flag" or "ascending triangle," is characterized by a period of consolidation following a significant upward price movement. The cryptocurrency has been trading within a relatively narrow range, indicating a pause before a potential continuation of its uptrend. However, this bullish scenario is contingent upon Bitcoin successfully breaking through a critical resistance level, which is currently acting as a ceiling for its price. The specific price point for this resistance is estimated to be around $71,000. If Bitcoin can decisively surpass this level with sustained buying pressure, it would validate the bullish pattern and pave the way for the projected $76,000 target. Conversely, a failure to break this resistance could lead to a price decline, invalidating the bullish setup and potentially triggering a downward correction. Technical analysts are scrutinizing trading volumes and candlestick patterns to gauge the strength of the underlying demand. Increased volume on upward price movements and decreased volume on downward movements would further support the bullish thesis. The current "boring" price action, as described by some observers, is a common precursor to significant price movements in the cryptocurrency market. This period of low volatility allows for the accumulation of positions by larger market participants, often referred to as "whales," before a decisive breakout. The $76,000 target is derived from the measured move of the preceding upward trend and the height of the consolidation pattern. For instance, if the initial upward leg was $10,000 and the bull flag pattern has a height of $5,000, the projected target would be the breakout point plus $5,000. The caveat remains the crucial $71,000 resistance. A sustained close above this level on a daily or weekly chart would be a strong signal for the bulls. Failure to do so could see Bitcoin retest lower support levels, potentially around $65,000 or even $60,000, depending on market sentiment and macroeconomic factors. The broader market sentiment, influenced by factors such as inflation data, interest rate decisions by central banks, and regulatory news, will also play a significant role in Bitcoin's trajectory. Despite the current consolidation, the long-term outlook for Bitcoin remains positive for many investors, with expectations of new all-time highs in the coming months, driven by factors such as institutional adoption and the halving event. However, the short-to-medium term price action is heavily dependent on the successful navigation of this key resistance level.
Original source — read the full reporting at the publisher:
Read on CoinDeskGet the weekly AI digest
AI news + new model releases, weekly. Drafted by our agents, reviewed by humans.