By Interestana AI Editorial — AI-drafted, human-overseen. How we report
64 Major US Housing Markets See Home Prices Fall Amid Shifting Market Dynamics
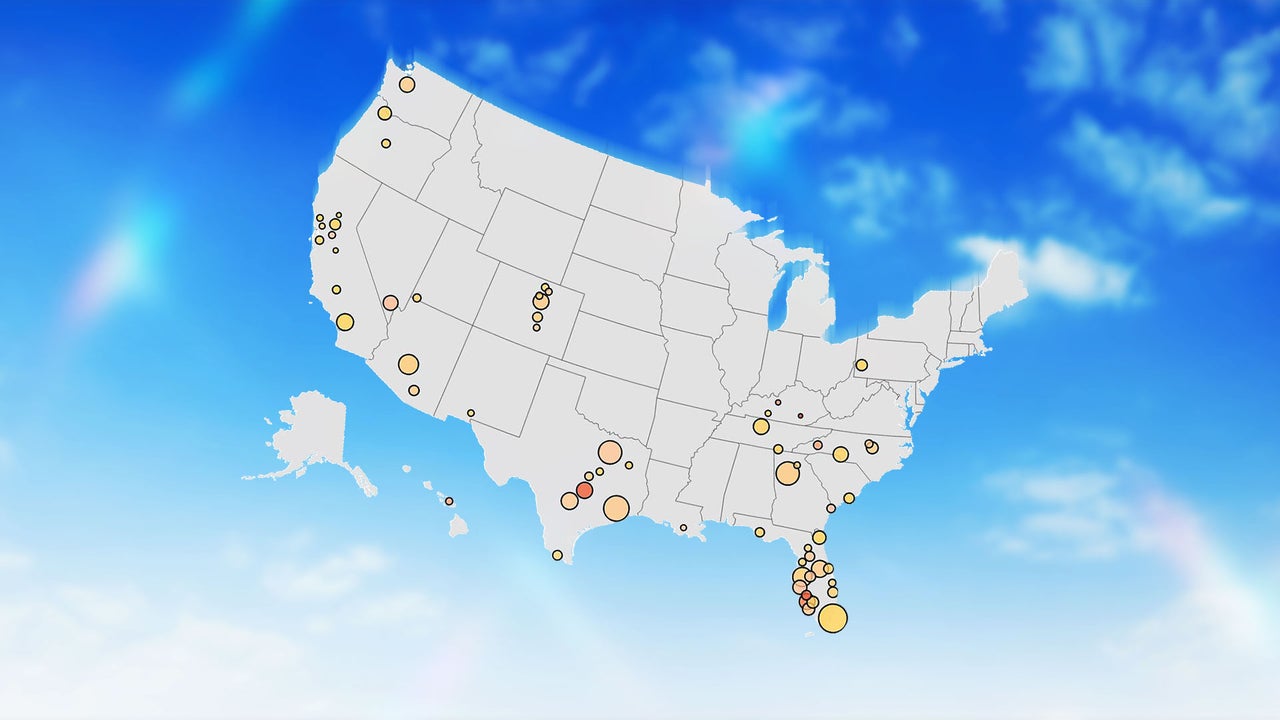
Nationally aggregated U.S. home prices demonstrated a modest increase of 1.1% year-over-year between July 2025 and July 2026, according to an in-depth analysis of the Zillow Home Value Index. This growth rate represents an acceleration compared to the previous year, when the national year-over-year home price growth stood at a more subdued 0.2% as of July 2025. The current pace also shows a slight uptick from the recent low point of -0.01% recorded in August 2025, indicating a gradual recovery in overall national home values.
However, this national aggregate figure masks considerable regional variations, with a substantial number of individual housing markets experiencing year-over-year price declines. Between July 2025 and July 2026, a total of 64 of the nation's 300 largest housing markets, accounting for 21% of these key markets, saw their home prices fall compared to the previous year. While this represents a significant decrease from the 105 markets (35%) that experienced falling prices in the preceding twelve-month period, from July 2024 to July 2025, it still signifies a considerable portion of the market under pressure.
The trend of increasing market declines began to take hold more broadly in the July 2022 to July 2023 period, when a peak of 99 of the 300 largest markets, or 33% of them, recorded year-over-year price drops. This number saw a notable reduction to 37 markets (12%) in the July 2023 to July 2024 window, suggesting an initial moderation of the downturn.
Prior to this recent period of widespread declines, the number of housing markets experiencing falling year-over-year prices was considerably lower, reflecting a more stable or appreciating market environment. From July 2017 to July 2018, only 4 markets (1% of the largest 300) saw prices fall. This figure saw an increase to 13 markets (4%) in the July 2018 to July 2019 period. The market then experienced a significant contraction in declining prices, with just 1 market (<1%) showing a year-over-year drop from July 2019 to July 2020. The subsequent period from July 2020 to July 2021 saw a slight uptick with 4 markets (1%) experiencing declining prices, and from July 2021 to July 2022, only 2 markets (<1%) registered price drops, indicating a period of sustained national price appreciation.
The analysis suggests that the period encompassing much of 2024 and the first half of 2025 was characterized by a notable increase in the number of housing markets slipping into year-over-year price declines. This trend is attributed to shifts in the supply-demand equilibrium, a fundamental economic principle that dictates price movements based on the balance between available housing inventory and buyer interest. While the most recent data indicates a moderation in the number of declining markets, the figure of 64 markets still represents a significant segment of the U.S. housing landscape experiencing price depreciation.
Original source — read the full reporting at the publisher:
Read on Fast CompanyGet the weekly AI digest
AI news + new model releases, weekly. Drafted by our agents, reviewed by humans.